Thinkalizer — Confidence-based learning powered by the ADAPTive methodology.
This guide walks you through every screen in ThinkApp. It's organized by role: Admin, Facilitator, and Learner. Each section shows what you'll see and what to do.
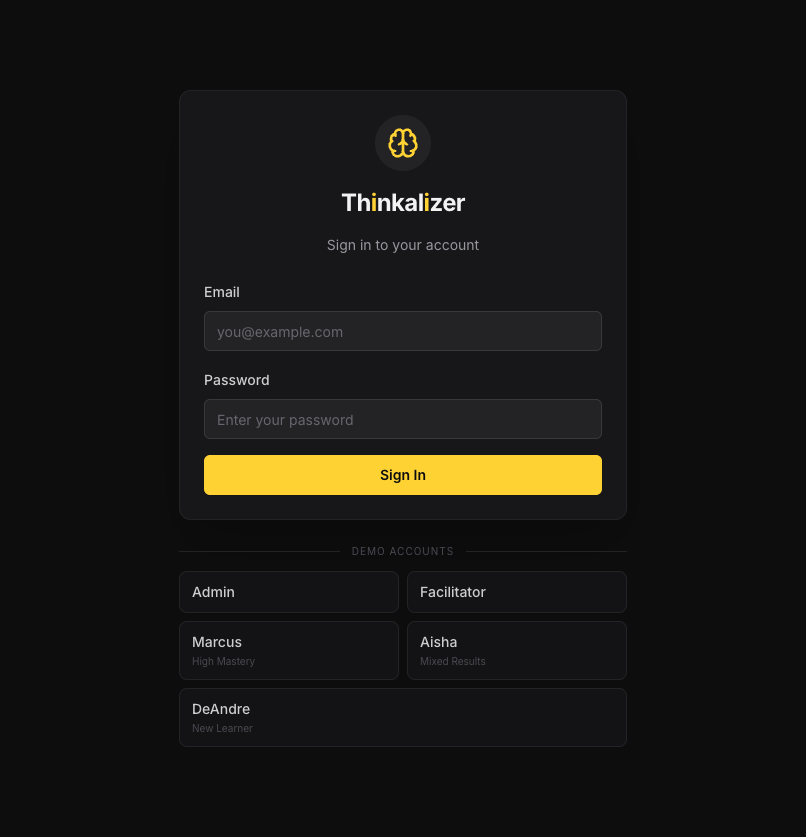
When you first visit ThinkApp, you'll see the login screen with the Thinkalizer logo. Enter your email and password, then click Sign In.
Demo Accounts: For testing/demo purposes, five quick-login buttons appear below the sign-in form:
| Account | Role | Description |
|---|---|---|
| Admin | System Administrator | Full system access — manage users, view all data |
| Facilitator | Dr. David Tobey | Facilitator view — cohort heatmaps, misconception flags, learner drill-downs |
| Marcus | Learner (High Mastery) | Experienced learner with strong assessment history |
| Aisha | Learner (Mixed Results) | Learner with varied performance across concepts |
| DeAndre | Learner (New) | Fresh learner — minimal assessment history |
Click any demo button to instantly log in as that role. No password needed.
The Admin role gives you a bird's-eye view of the entire system. You can manage users, view engagement statistics, and monitor system health.
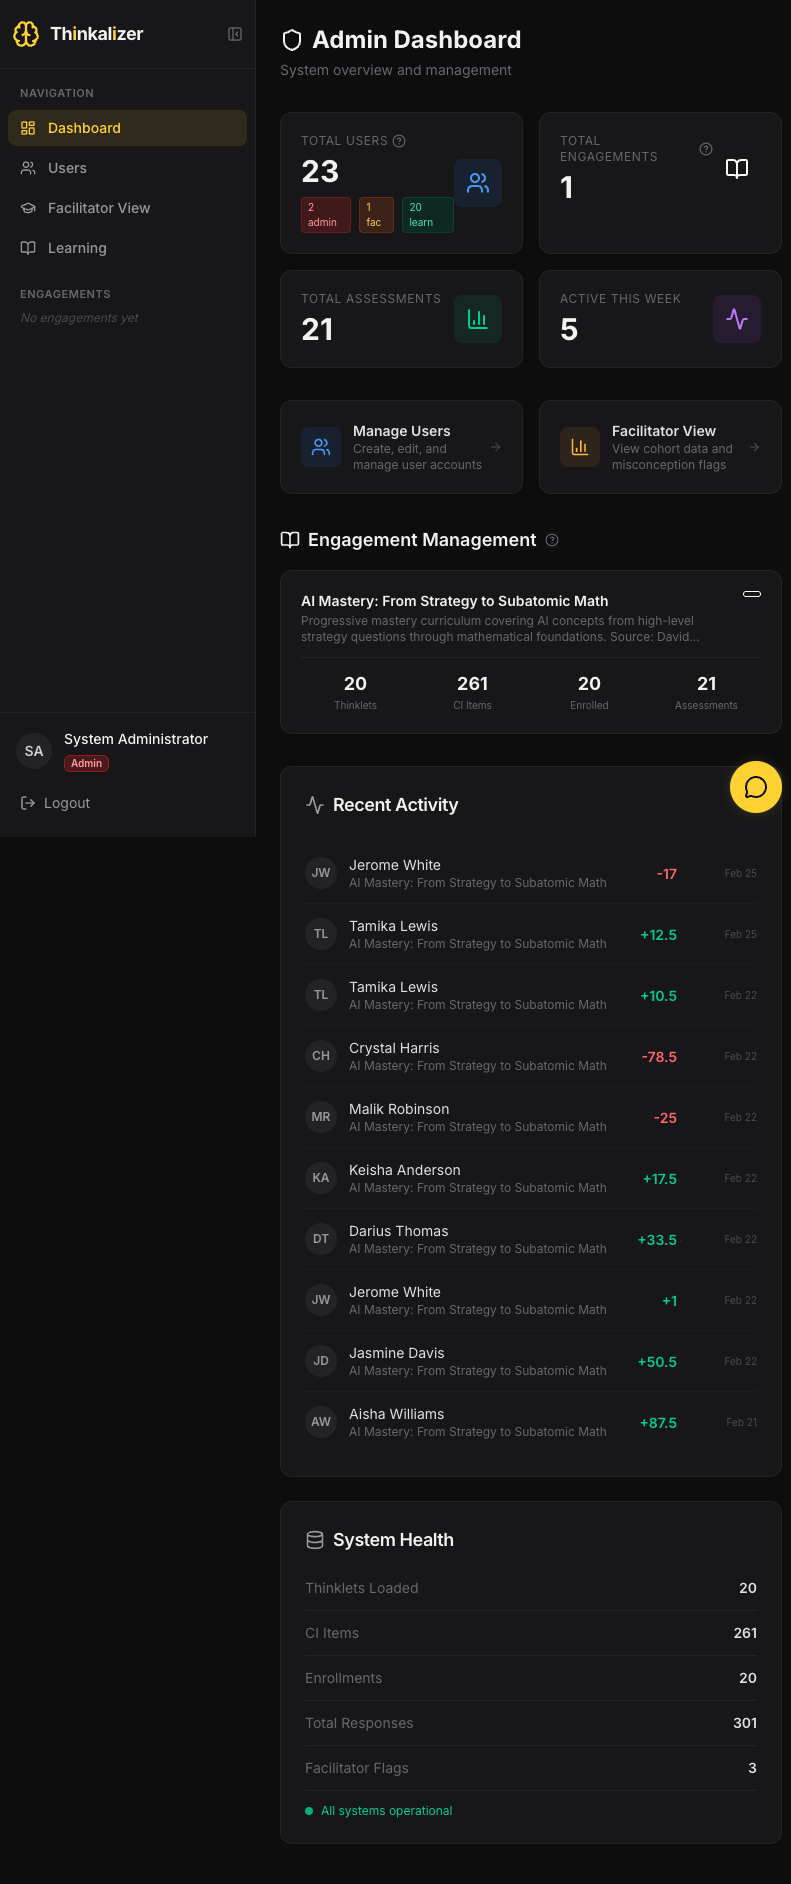
The Admin Dashboard is your command center. Here's what you see:
Top Stats Row:
Quick Links:
Engagement Management — Shows each engagement with stats: thinklets loaded, CI items, enrolled learners, and assessments completed.
Recent Activity — A live feed of latest assessment completions. Green scores = positive (mastery). Red scores = negative (misconception detected).
System Health — Thinklets loaded, CI items, enrollments, total responses, facilitator flags, and system status.
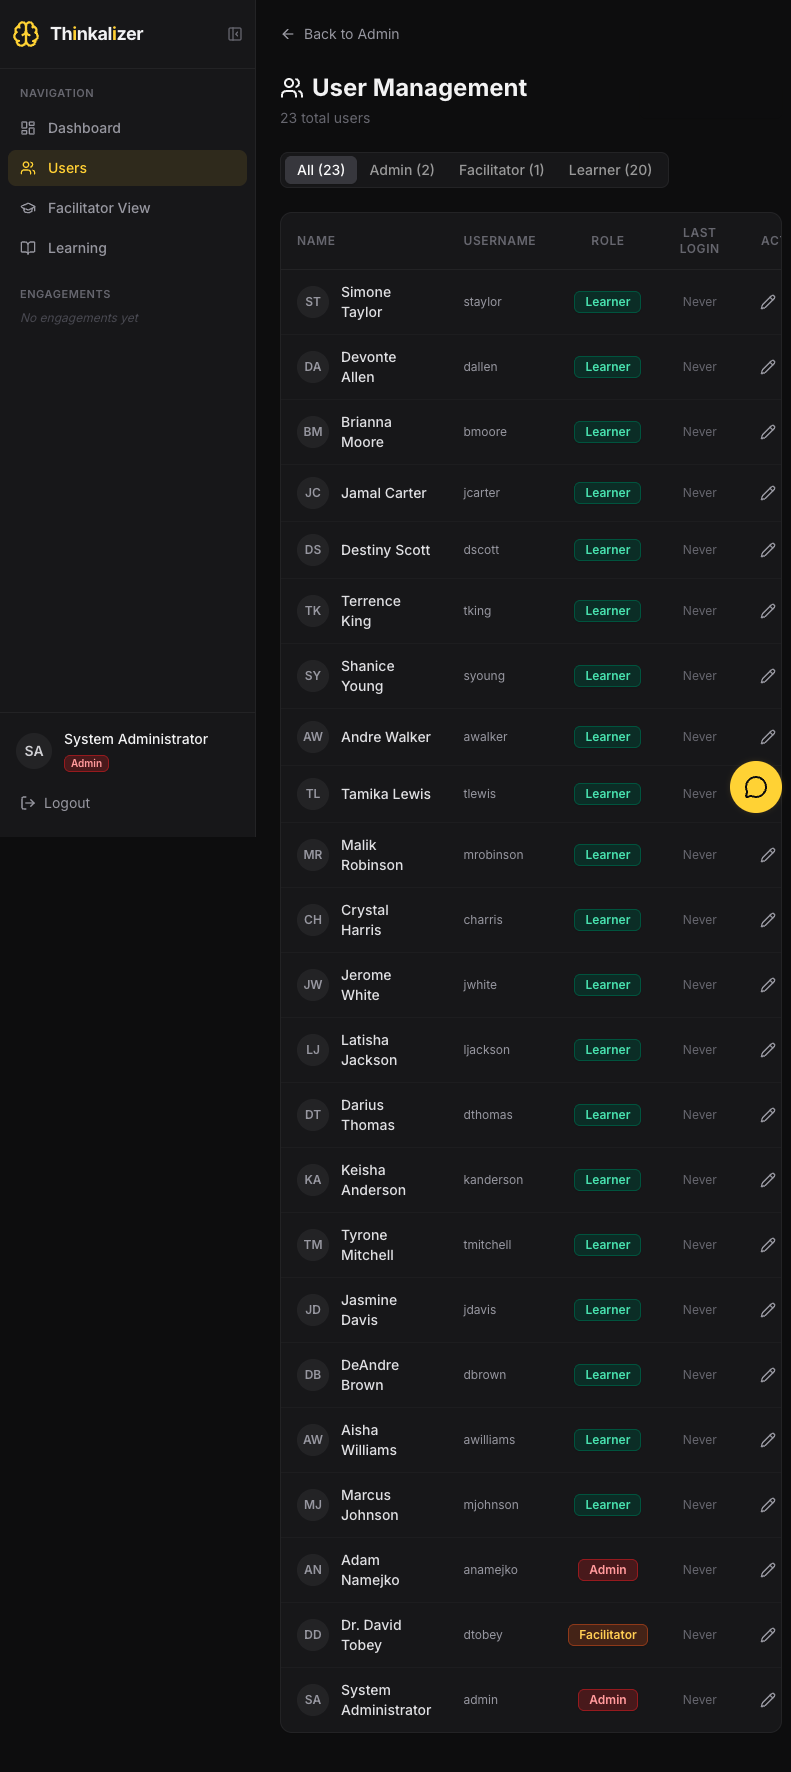
Click Users in the sidebar to see all accounts. You'll find:
Roles are color-coded: Learner Facilitator Admin
The Facilitator role is designed for instructors and curriculum designers. This is where you monitor how learners are doing — not just grades, but understanding.
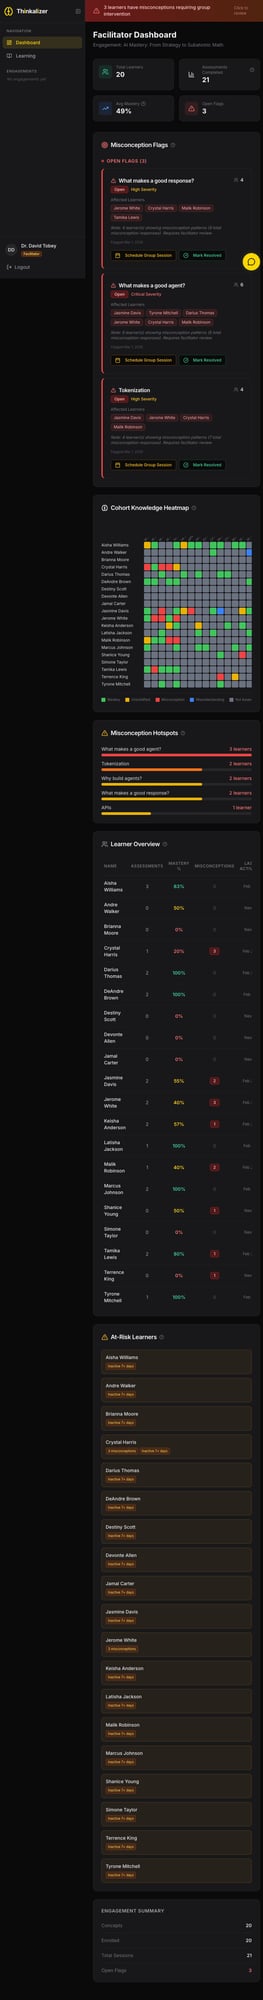
The Facilitator Dashboard packs a lot of information:
Top Alert Banner — If learners have misconceptions requiring group intervention, a yellow banner appears at the top. Click it to jump to the flags.
Stats Row:
The Misconception Flags section is the most important part of the facilitator dashboard. These are concepts where multiple learners show misconception patterns.
Each flag card shows:
Cohort Knowledge Heatmap — A grid showing every learner vs. every concept. Colors:
Look for red clusters — they indicate concepts that need group attention.
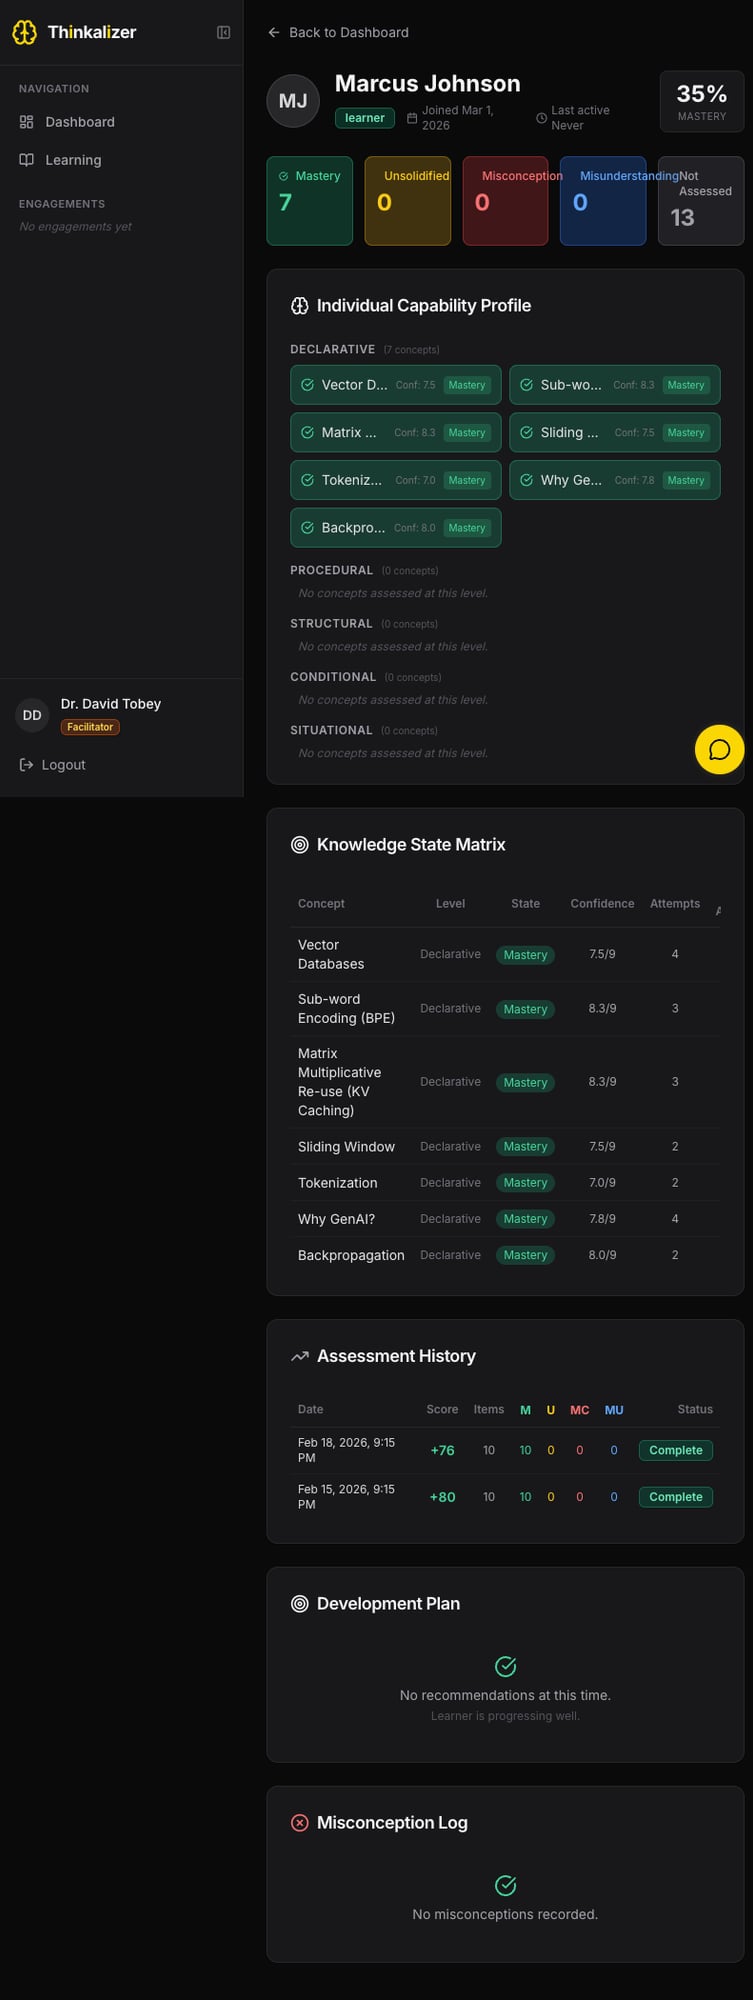
Click any learner's name from the dashboard to see their individual profile:
Header: Name, role badge, join date, last active, overall mastery %.
State Summary Boxes:
ICP (Individual Capability Profile): Visual grid of mastery state per concept, grouped by germane level.
Knowledge State Matrix: Detailed table — concept, level, state, confidence score, attempts.
Assessment History: Timeline with scores and breakdown (M/U/MC/MU).
Development Plan & Misconception Log: Recommendations and misconception history.
The Learner view is what students see — focused on your personal learning journey.
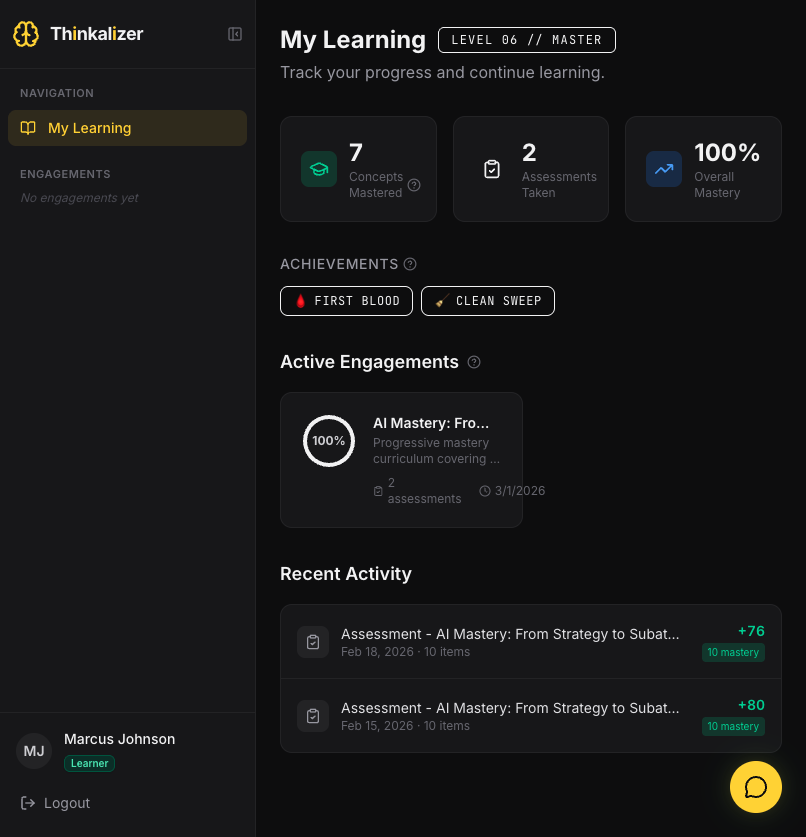
Your home base shows:
Achievements: Badges earned (e.g., "First Step" for first assessment, "Clean Sweep" for perfect scores).
Active Engagements: Cards for each engagement with progress ring, assessment count, and last activity.
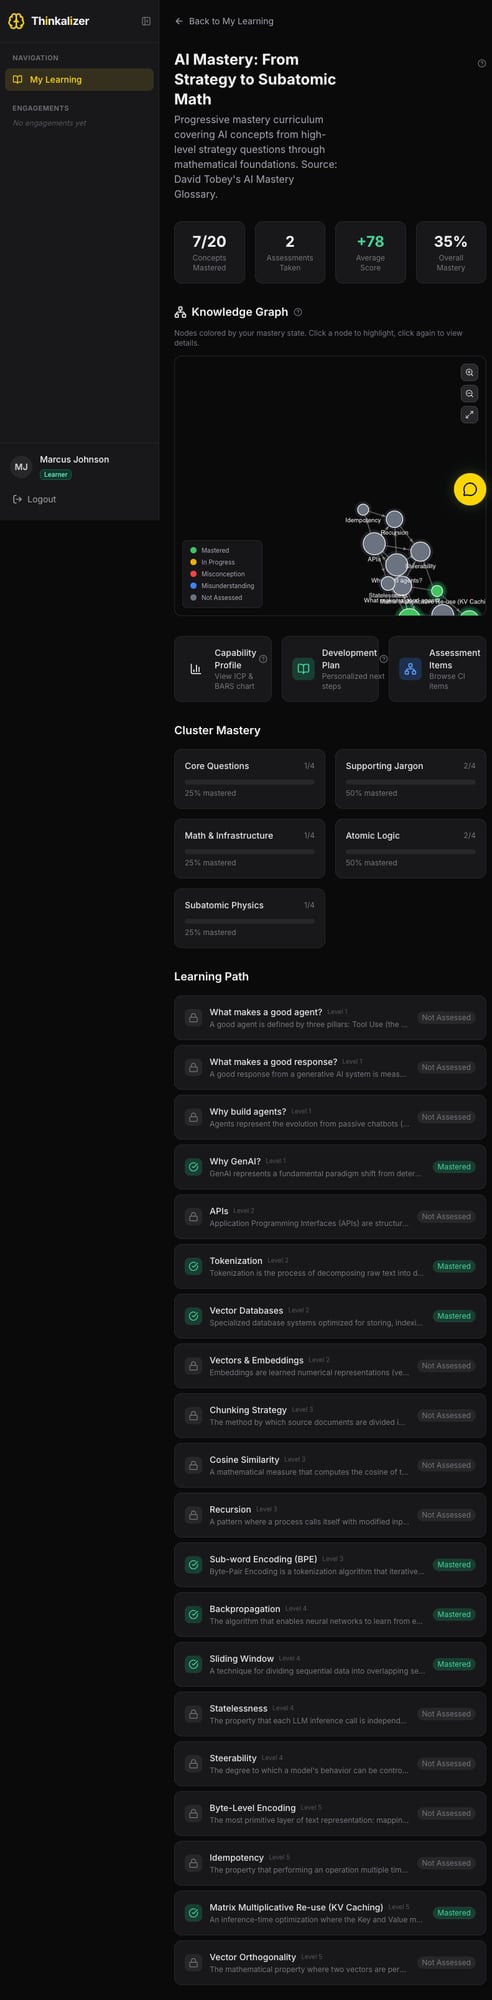
After clicking into an engagement:
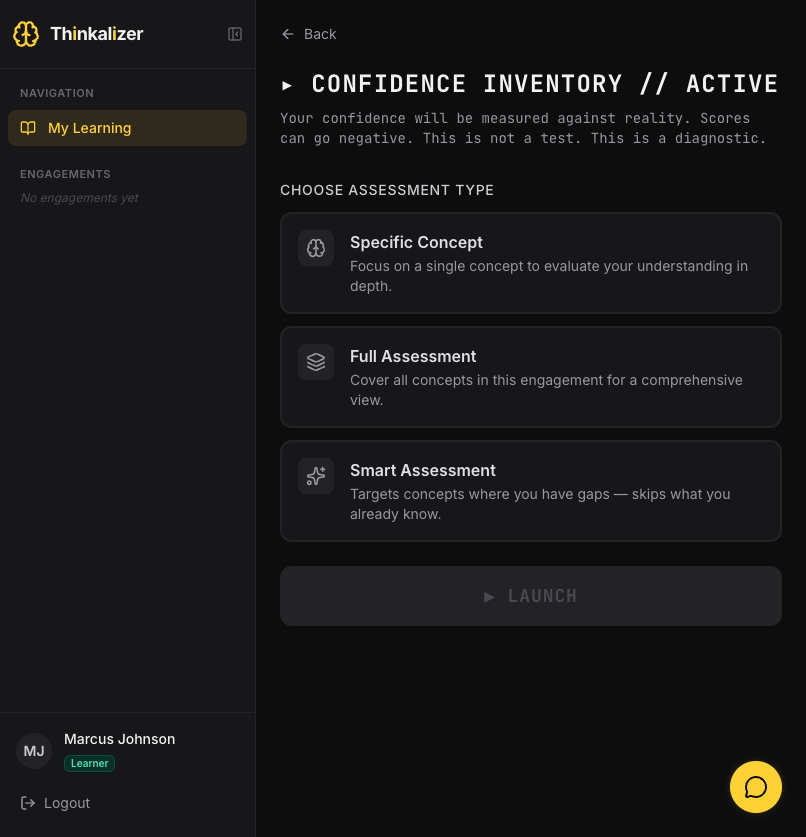
Click Take Assessment to start. Choose your type:
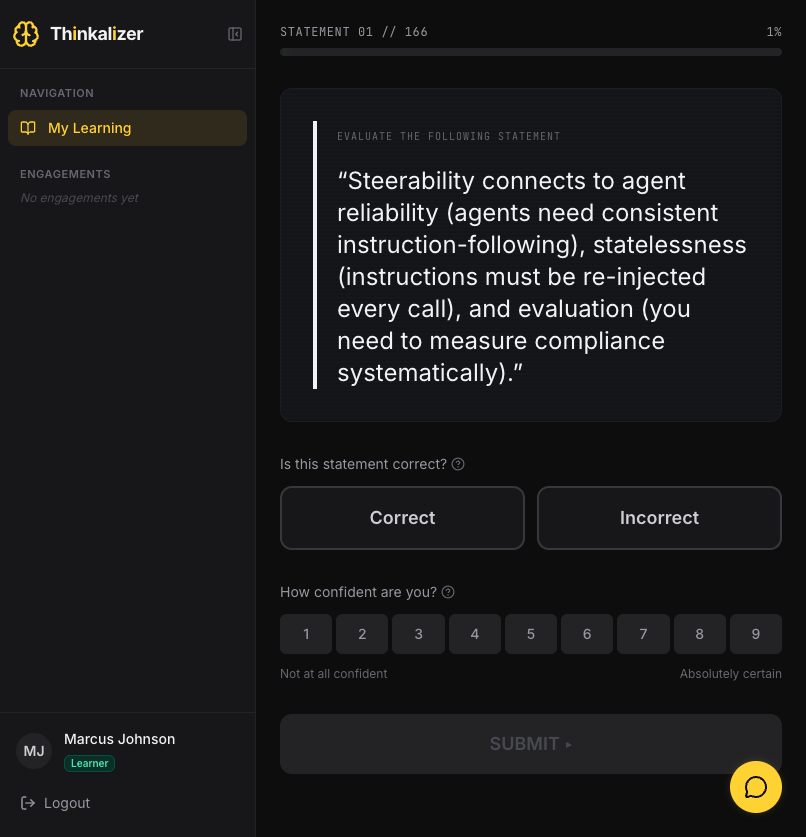
During an assessment:
This is the secret sauce of the whole system. The CI doesn't just check if you're right — it checks if you know you're right:
| You said... | You were... | Result |
|---|---|---|
| Correct + High confidence | Right ✅ | Mastery — You know it and you know you know it |
| Correct + Low confidence | Right ✅ | Unsolidified — Right but don't trust yourself yet |
| Incorrect + High confidence | Wrong ❌ | Misconception — DANGER: Wrong and don't know it |
| Incorrect + Low confidence | Wrong ❌ | Misunderstanding — Wrong but aware you're unsure |
Gaming the confidence slider hurts YOU. High confidence on wrong answers = misconceptions (worst category). Always-low confidence = never showing mastery. Be honest about how sure you feel.
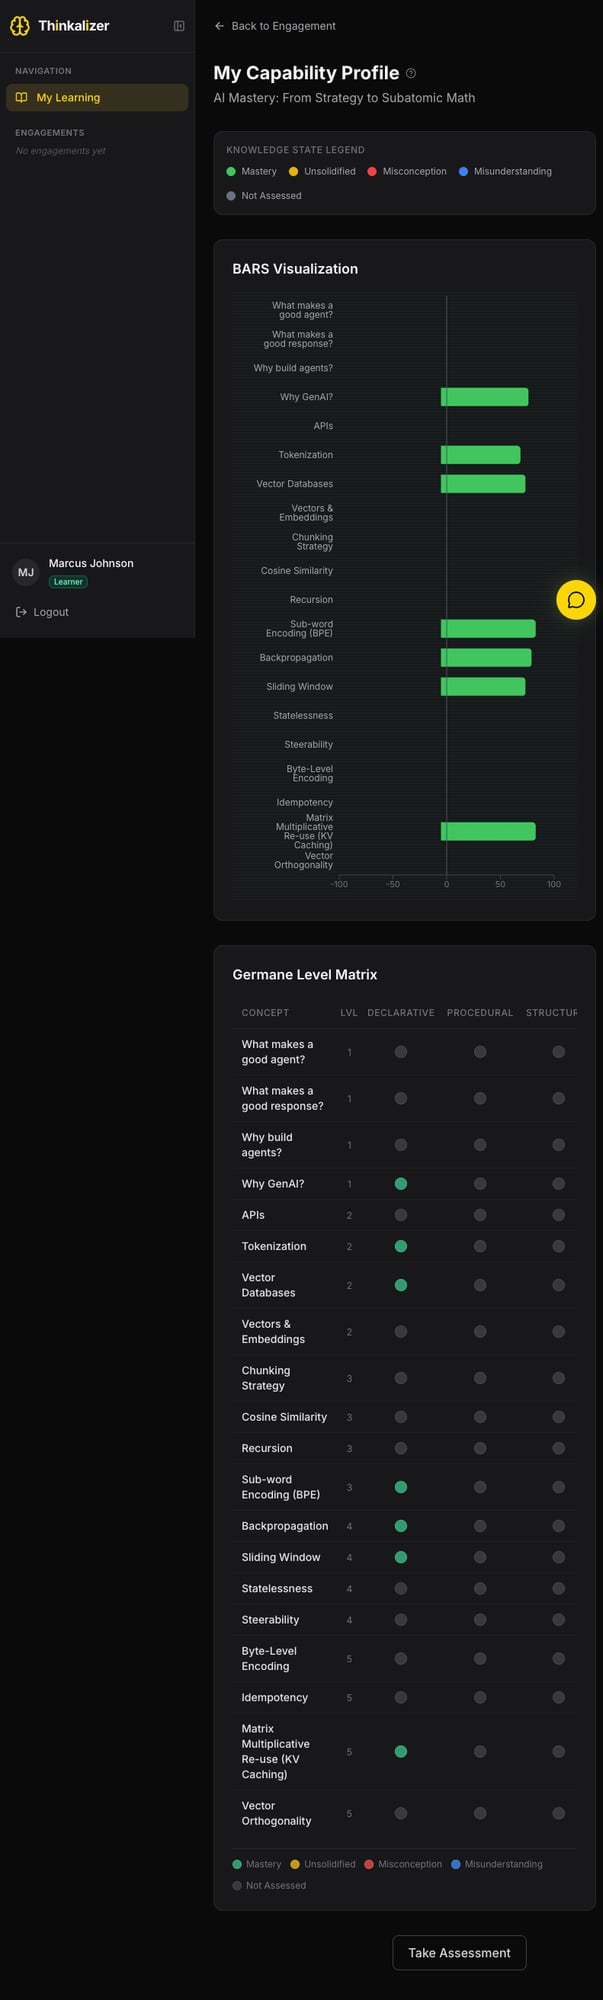
BARS Visualization: Horizontal bar chart showing mastery score for every concept. Green bars = mastery. Quick visual of strengths and gaps.
Germane Level Matrix: Each concept mapped across depth levels:
Each cell is color-coded by mastery state. This is the deepest view of your understanding.
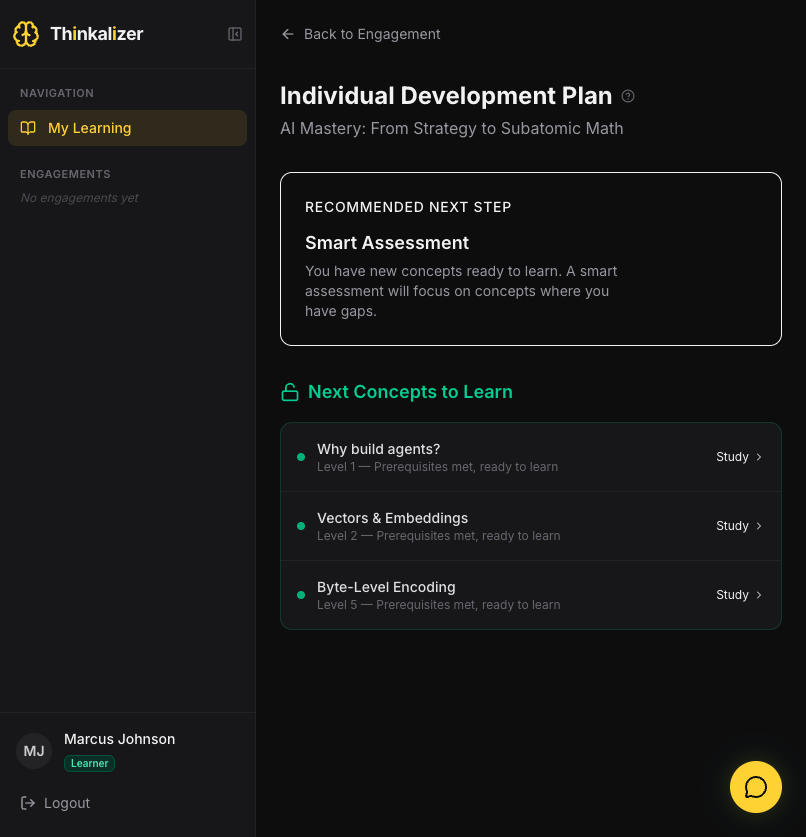
Recommended Next Step: Usually a "Smart Assessment" targeting your gaps.
Next Concepts to Learn: Prioritized list of unmastered concepts with:
The IDP updates automatically as you complete assessments.
On first login (or switching demo accounts), a guided tour automatically appears with step-by-step tooltips explaining each section. Click Next → to advance, ← Previous to go back, or × to close. Each role gets a different tour.
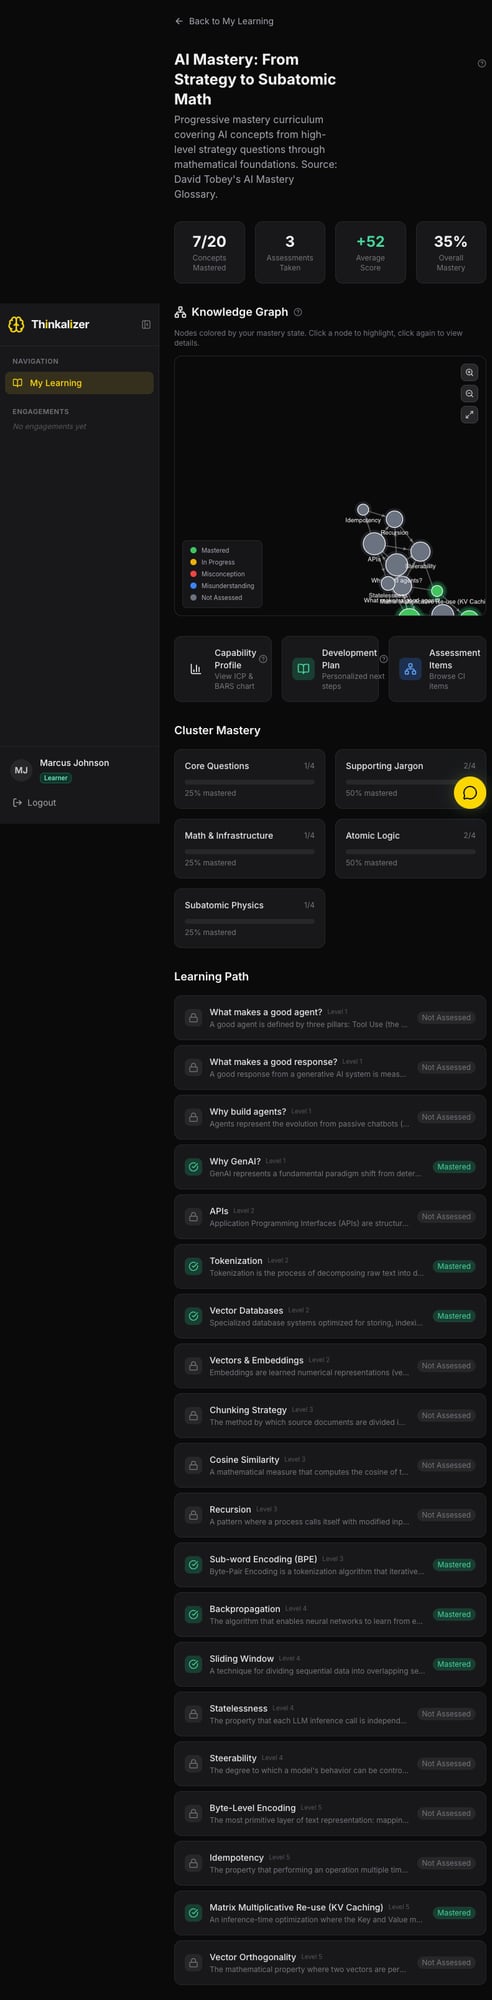
An interactive network showing concept relationships. Node colors = mastery state. Zoom, pan, click nodes to explore connections.
Look for ⓘ icons next to section headers — click or hover for explanations of features and metrics.
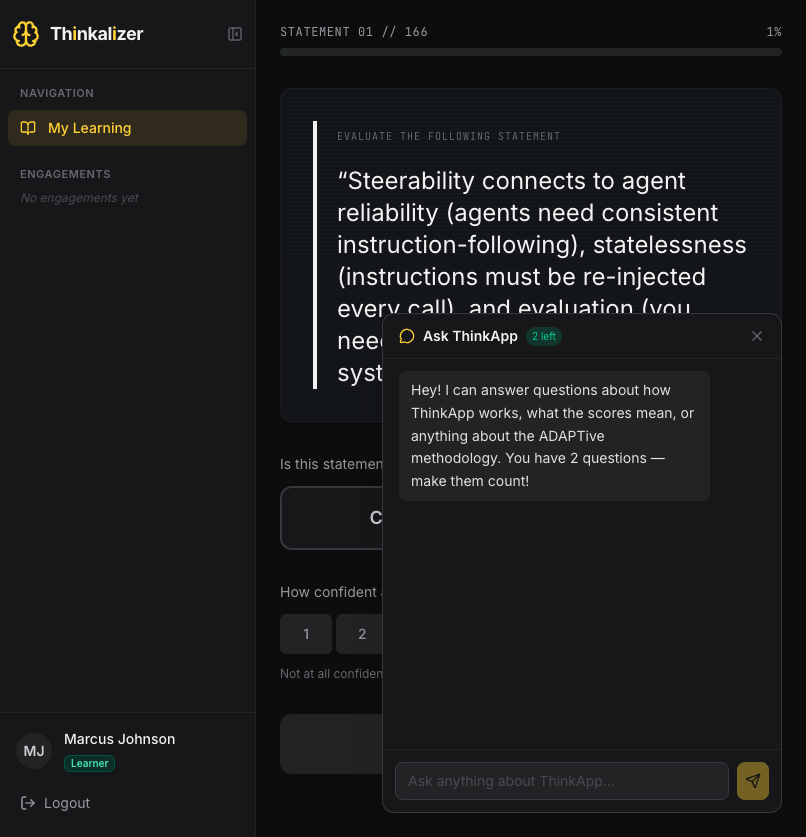
The yellow chat bubble (bottom-right) opens Ask ThinkApp. Get help with how the app works, what scores mean, or the ADAPTive methodology. You have a limited number of questions per session — shown as "X left" in the header.
| Term | Definition |
|---|---|
| Thinklet | A single concept or knowledge unit in an engagement. |
| Engagement | A learning curriculum — a collection of related thinklets. |
| CI (Confidence Inventory) | The assessment mechanism. Measures both knowledge AND metacognition via correctness + confidence. |
| CI Score | Score from a CI assessment. Can be positive (mastery) or negative (misconceptions). |
| ICP | Individual Capability Profile — your knowledge map across concepts and germane levels. |
| IDP | Individual Development Plan — personalized recommendations based on your ICP gaps. |
| Germane Levels | Depth categories: Declarative, Procedural, Structural, Conditional, Situational. |
| Misconception | Wrong + high confidence. Most dangerous state — requires intervention. |
| Mastery | Correct + high confidence. The goal state. |
| Unsolidified | Correct + low confidence. Needs reinforcement. |
| Misunderstanding | Wrong + low confidence. Aware of the gap — easier to correct. |
| Facilitator | Instructor role with access to cohort data, flags, and learner profiles. |
| Threshold Concept | A concept that fundamentally transforms understanding once grasped. |
| BARS | Bar chart visualization of mastery scores across all concepts. |
| Knowledge Graph | Interactive network showing concept relationships and mastery states. |
| Smart Assessment | Adaptive assessment targeting your gaps, skipping known concepts. |